


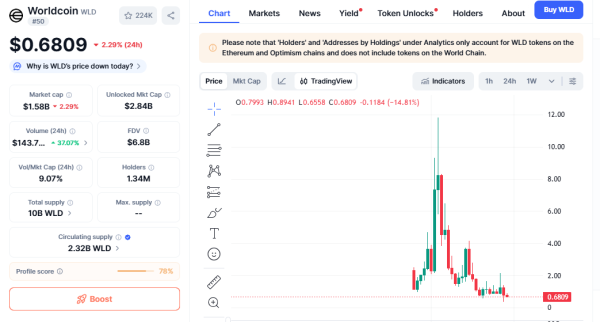


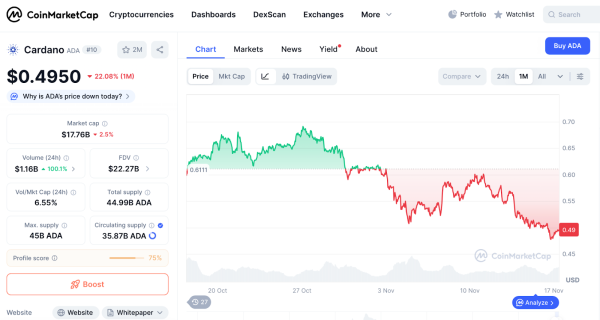


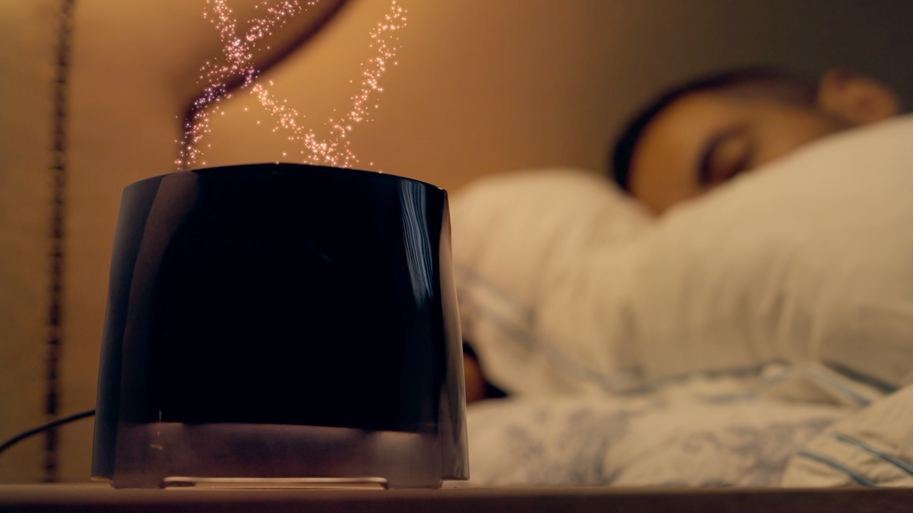
While many existing sleep solutions focus primarily on monitoring through smartwatches, sleep pads, or tracking apps, Honey IT recognized the need for a device that actively supports better sleep without invasive methods. Znie S-300 uses brainwave synchronization through non-contact E.L.F. (Extremely Low Frequency) technology, providing a gentle, science-backed approach to improving sleep quality.
A Smarter, More Comfortable Way to Rest
The Znie S-300 offers an upgraded sleep experience with two intelligent modes. Sleep Mode creates a calming environment with Pink Noise, low-frequency patterns, and soft ambient light, while Wake Up Mode gently wakes you with gradual light and tonal transitions for a smooth, pleasant start to the day. Featuring an auto-modulated 8-hour cycle, the device seamlessly transitions throughout the night, helping you unwind naturally and wake up refreshed.
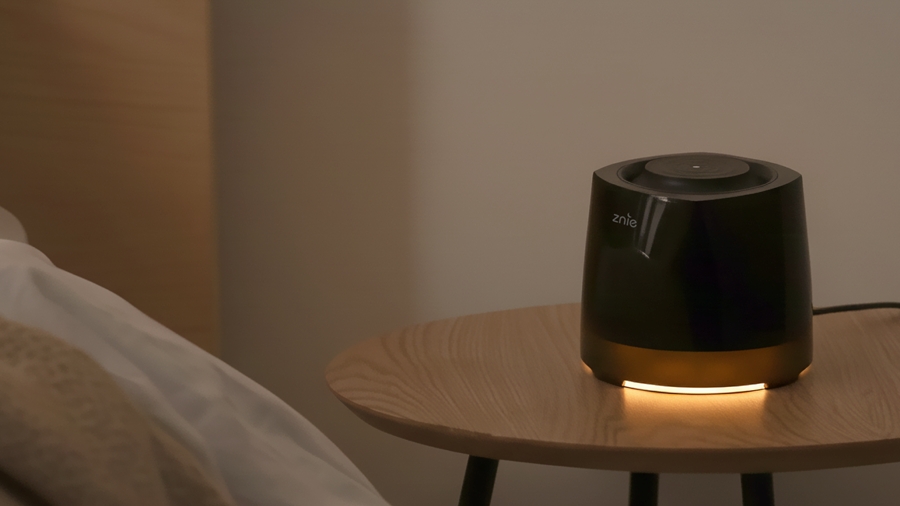
Everyday Comfort Meets Smart Design
- Next-gen sound technology using ELF-based patterns
- Simple USB-C connection for instant use
- Sleek, modern design for home, office, or bedside
- Intuitive one-button wheel control for effortless adjustments
“With growing concerns over reduced sleep and overall sleep wellness, the sleep market is expanding rapidly. We designed Znie S-300 to provide a comfortable, non-invasive, and reliable sleep solution for daily life,” said James Son, Founder of Honey IT.
The Kickstarter campaign for Znie S-300 will launch soon, offering early supporters exclusive rewards and limited early-bird pricing. Sign up on the pre-launch page to be the first to know when it goes live.
About HONEY IT
Founded in 2015, Honey IT is a sleep technology company dedicated to creating non-invasive, user-friendly devices that enhance everyday wellness. With a focus on sleep and relaxation, Honey IT combines innovative engineering, research, and real user feedback to develop products that improve lifestyle and well-being worldwide.
Media Contact
Company Name: Honey IT
Contact Person: Media Relations
Country: United States
Website: https://www.zniesleep.com/